[From Wrike] New Dashboards Are Here: Upgrade to the New Experience in Wrike Labs! 🔬

Hello Community,
As you know, Dashboards are one of the best resources to keep track of your work and a very popular tool in Wrike 😉 If you are familiar with this feature, you will be excited to hear that New Dashboards have just been released and you can try their new design and experience their power 💪 by enabling them in Wrike Labs 🔬
Note: New Dashboards are enabled for the whole account, and are located in their respective Spaces; for this reason, they cannot be accessed through the Dashboard menu.

Once an admin or the account owner has enabled the option in Wrike Labs for the whole account, users can upgrade their existing Dashboards to the new experience by clicking on the “Upgrade to New Dashboards” button, at the top:
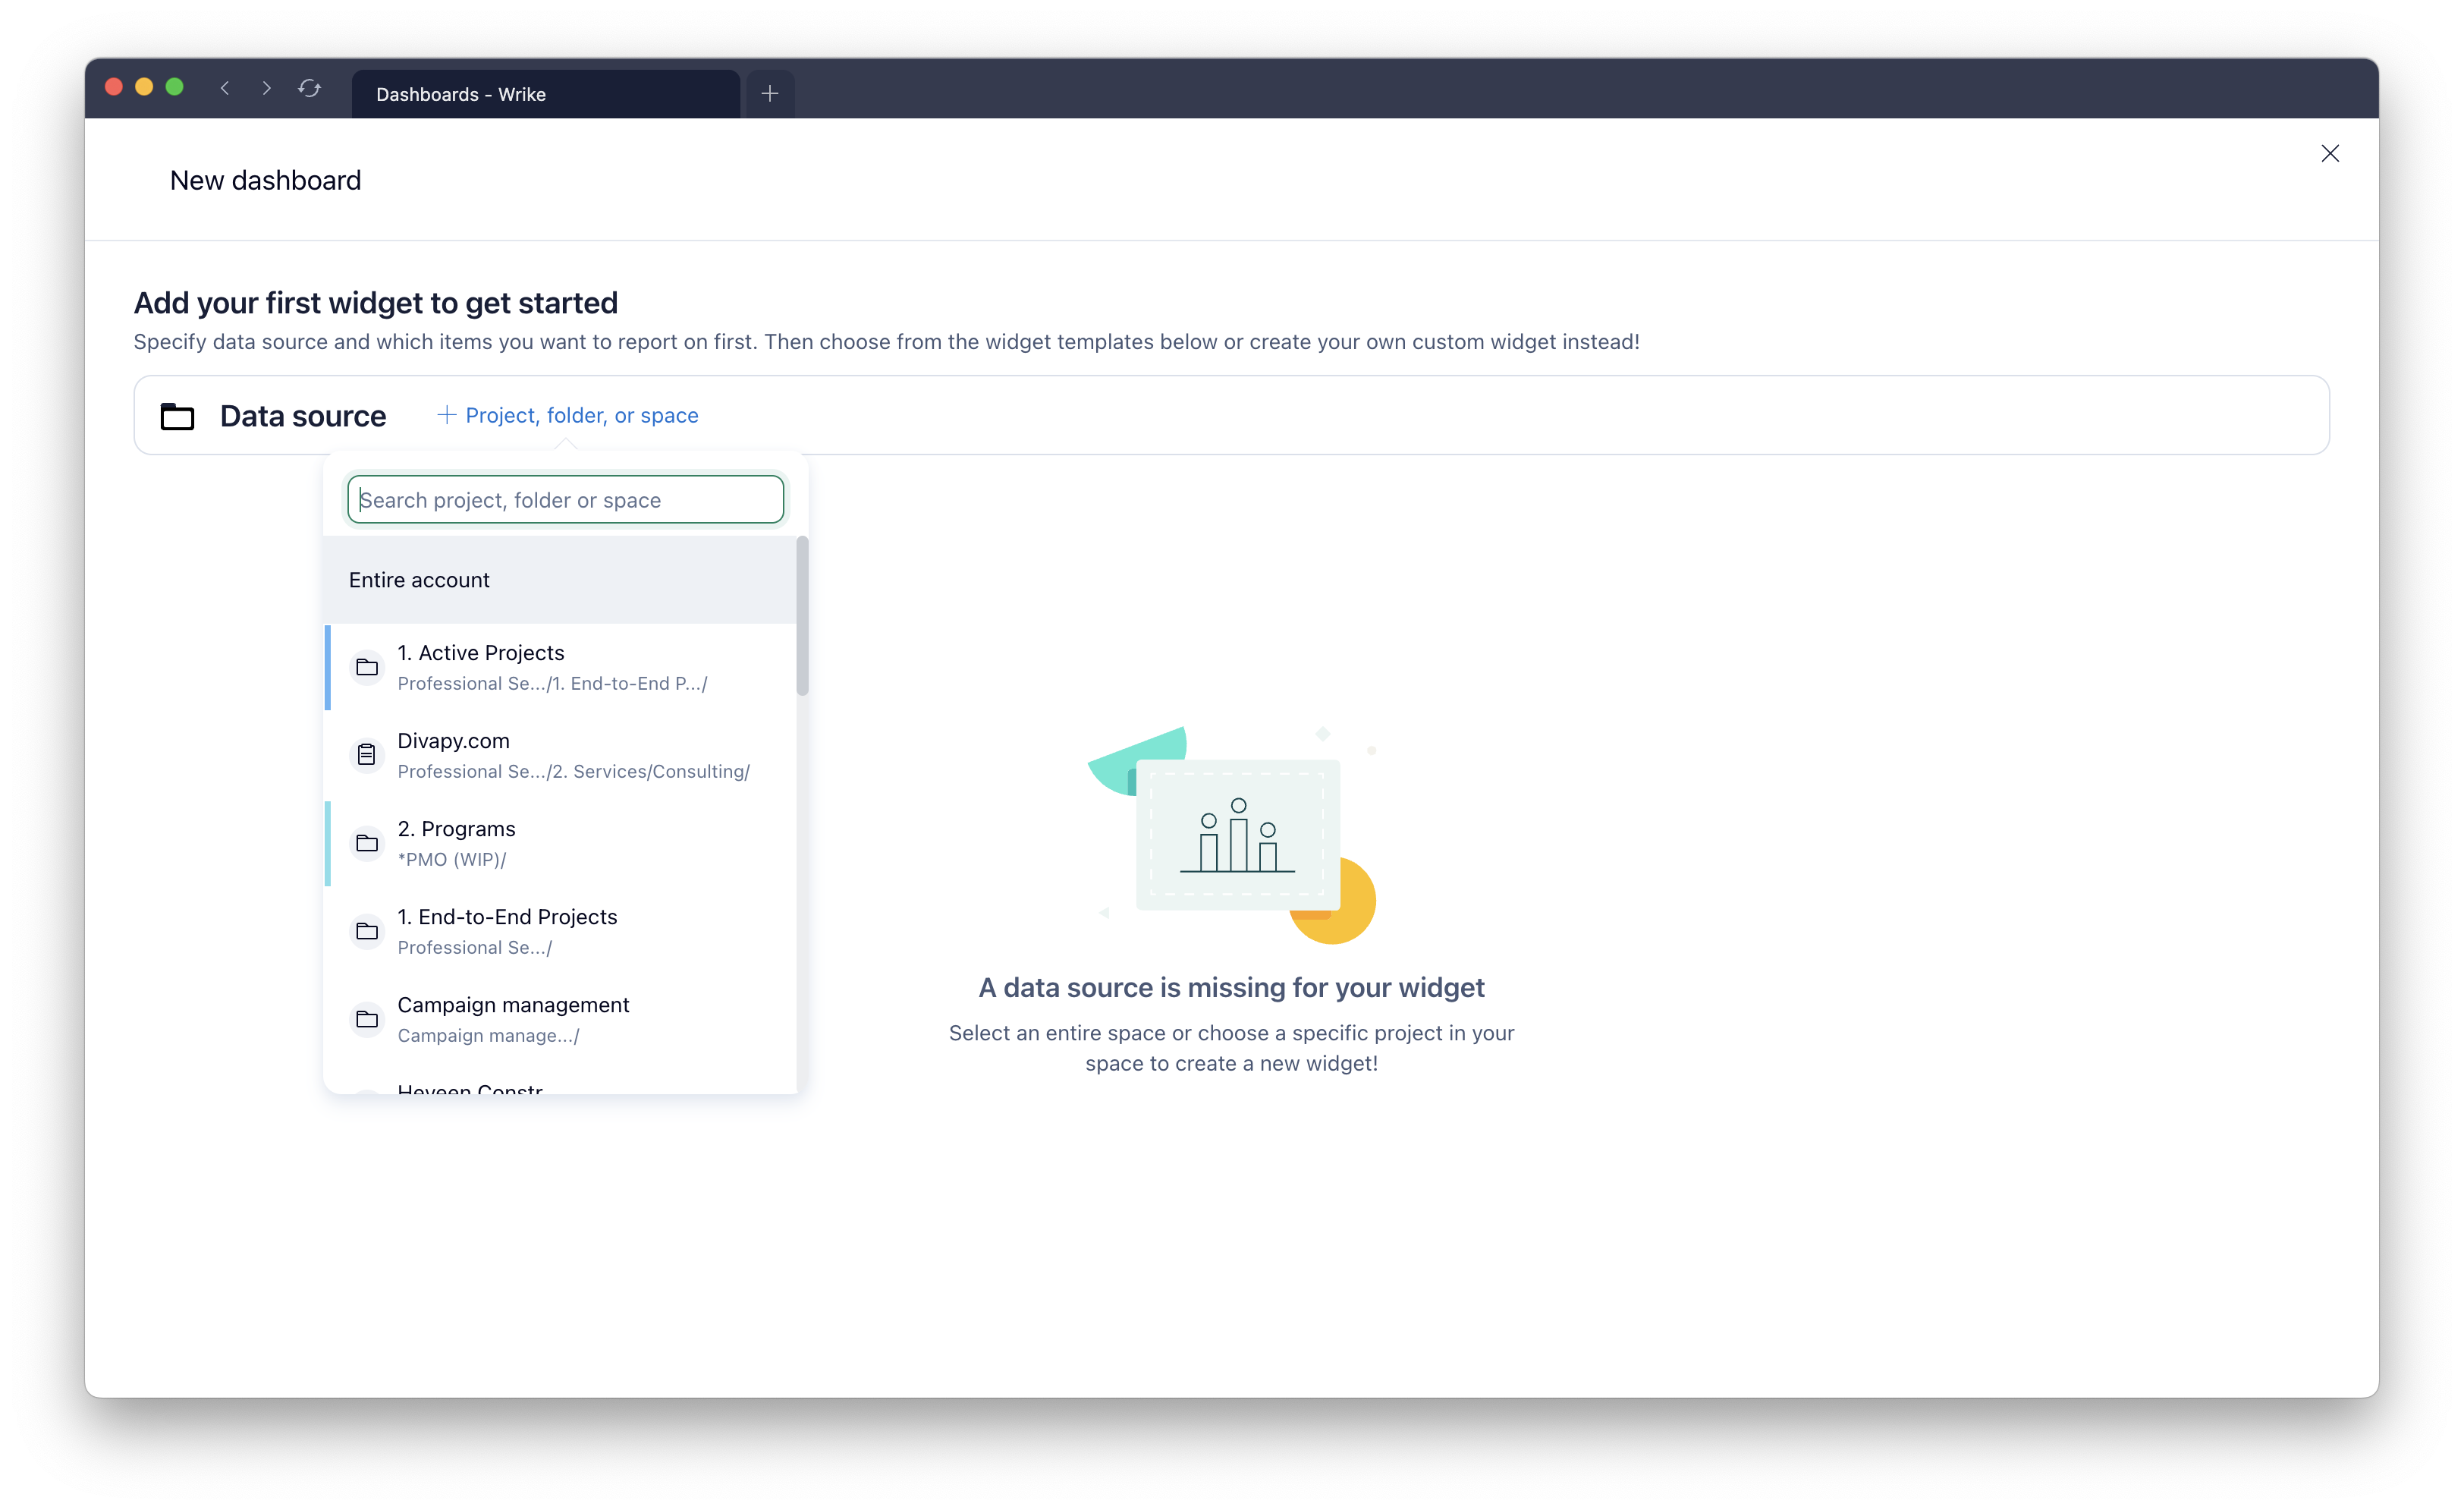
Also, you can navigate to the relevant Space and on the Tools section, start creating a new Dashboard from scratch:

You can create custom widgets or use templates to save time. When creating a custom widget in the New Dashboards, you can now determine if you want it to be based on tasks, custom item types or projects:

Also, you can choose which information you want to display in as many columns as you wish:

You can also sort the information included in your widget by Priority, Name, Status, or Due date:

With such an amount of information to display, the New Dashboards also include the possibility to modify the size of your widgets easily:


📈Charts in Dashboards
And that’s not all! Dashboards now include multiple visualization formats, including: Table,
Indicator, Donut, Column, Bar, Line, Tree map, and Area charts!


Don’t miss the chance to try this upgraded version of Dashboards, and please let us know your thoughts in the comments section below 👇
Please, note that this feature is being piloted and more updates will be available soon. Widgets like starred tasks, activity stream, file widget and pending reviews are not supported yet.
Do you have any questions? We are always here to help 👂
The metrics when viewing by status, automatically sets the bars from highest to lowest count. Would be great to have option to order by the workflow order. Because you want to see where along the workflow the count of the status (hope that makes sense).
Ive never thought about it, but I love this idea!
Yes, it does Jun! It totally makes sense, and we have different sorting options for charts on our radar. Thanks for another good piece of feedback.
Same comment as Jun Jet Davies but for any field. Let us choose the order of the bars instead of defaulting to largest to smallest. I'd like to do this for a custom field.
I was going to say another idea that's been in the Feedback form for a while was to allow grouping on Wrike's default dates (see post here). But I see the Wrike team has already added this feature. This is awesome!!!
Jun, I owe you a response on not all statuses showing up in filters. It's a known aspect of new dashboards and chart view with a focus on analytics. We only display values in filters that are present in the data.
We are planning to add "Show all" option to filters that displays all possible values for a field, not just those that are present in the data.
I've created a generic dashboard that shows active, upcoming, and overdue tasks for the user viewing the report. I would love a filter for Due Date that allows me to select "blank" so that I could have a widget for "backlogged tasks".
Feedback, the metrics don't update automatically when data is updated. ie/ status change. See screenshot. You have to manually refresh the page. Most people expect (especially non tech people) real time?
Hey Ashley! Please use the filter by Task Type for that. You can get backlogged tasks easily.
Jun, that's right. New dashboards work fine for viewing/browsing them, but we do not fully support online updates yet, and it's a pretty complex thing and a work in progress. Please expect improvements over time. We are listening to the feedback and will prioritize higher if it becomes an issue for many.
Hi Vladimir
Update regarding status workflow unable to filter by status that are only present in data does not make sense if it's focusing on analytics? Analytics is looking at past (if this data is available) present and future (what is likely/not likely to happen - ie/ Wrike workflows).
Also it's causing widget titles to revert. I've raised a ticket about this. #1395764
https://help.wrike.com/hc/en-us/community/posts/17181596763415/comments/18011701157399
https://help.wrike.com/hc/en-us/community/posts/17181596763415/comments/18025177295511
Is there a possibility to create a new dashboard for the whole account, not limited to a specific space?
Jun, we are working on adding "Show All" option to filters so it would be possible to set filters on values that are not present in the data currently. The issue with the widget title is acknowledged and will be fixed this week.
Florian, new dashboards are always created in a space, but you can share them and use data from the entire account. Simply change a data source to the Entire Account in the picker. In other words, it's possible to set up account-wide reporting with new dashboards and share them organisationally-wide.
Thanks @...,
this should be OK. But I experienced the following issue: If I select a new dasboard from the "old" global dashboad section in the left menu, this dashboard is always opened in a new tab! If I pin this dashboard and open it from the "pinned" section, it works as usual.
Florian, it's a little early to go into that in-depth, but we decided to display only classic dashboards upgraded to new ones in this list. New dashboards created from scratch are not even shown in this dropdown because we expect users to navigate to them from the Tools section in spaces, where they are created in the first place.
The current approach with navigation through dashboards via dropdown under the Dashboards tab doesn't scale well. It works fine for a few dashboards but becomes hardly manageable when dozens exist. So we are changing that slowly, and that's why new dashboards are opened in a new tab from the drop-down. It's because they don't have that drop-down at all. Hope that helps.
Hi Vladimir Bugay,
thanks for this explanation, very interesting!
But I have to tell you that also old dashboard beave the same way as newly created ones, after I convert them to new dashboards.
Btw I'll miss the dropdown list! And I experienced that if I open an old dashboard from the pinned section, the dropdown is also hidden!
Hi @...!
The new dashboard tool is a HUGE improvement. Keep bringing that overly complex Sisense functionality to Space level. We love it.
A few suggestions (I was going to include screenshots, but this is long enough the way it is):
Thanks again!
Michael, thank you for inspiring feedback, and I'll definitely pass it on to the team. Please see my responses below:
1 - Duplicate/move dashboard functionality will be available within days
2 - This is an interesting idea I will entertain it with the team. Effectively, you're talking about sharing a dashboard to a space, not a user or group.
3 - You're right, by default dashboards, like any other tool, have the same permissions as a space they belong to. Those permissions can be customized but in an additive way. Unfortunately, there is no way to take them back. Good point.
4 - This is in our plans and will be added relatively soon
5 - We are planning to add various chart customization options gradually. For the total number, we recommend using indicators in separate widgets.
6 - I'm sorry but I didn't get this one. Can you please elaborate?
7 - We are using the same component as the new table view, which allows sorting only by one field. I'll check with the responsible team if it's something that can be added.
8 - We are planning to significantly improve the experience related to handling dates, so stay tuned!
@... Here ya go. Thank you for the quick reply! Additional input you requested:
2 - Basically, this would allow one dashboard to be viewed across multiple Spaces that we choose. However, the security around those Spaces are not the same. The PMO team has full access to their Space. The developers full access to their space and no access to the PMO space. We would not want the developers (or any users of other spaces for that matter) to be able to modify our PMO dashboards. Hope that helps clarify.
3 - It would be more helpful if this were to work like folders, where they do not have to inherit Space level. What other options would you suggest for controlling and securing the Dashboards so they are not modified by just anyone? These dashboards will also be viewed by Executive management, so we need to ensure they not being modified.
5 - Thank you. We are doing that now as shown below:
6 - See below (similar to the Sisense capabilities of displaying the data below the Chart vs to the side):
Michael, thank you for clarifications! On #2, there is no silver bullet, but you can try different options. Access roles can be used to restrict who can edit dashboards. I would also limit the permissions of users "external" to a space in that space so Developers do not have full/admin permissions in the PMO space. In other spaces, there are two options to expose a dashboard to users. The first one is to use bookmarks and add a link to a dashboard as a bookmark in a space. Alternatively, users can pin a dashboard for themselves when they have access to it. Finally, are you aware of the Shared with Me virtual space? That's where users can see all tools/work that is shared with them, so developers should be able to find the dashboard from the PMO space there.
https://help.wrike.com/hc/en-us/articles/1500005217402-Shared-With-Me
Michael and others, I just wanted to let you know that the move/duplication of new dashboards has been released. Have a nice weekend!
@... That is some great news on a FRIDAY! Thank you for all your hard work!
New Dashboard Feedback - Editing Templated Widgets
I have noticed that if we add a widget from a template, like My Tasks, then when we go to edit the widget with filters, that option does not appear. Is this something that will be updated in the future? For now, we are just using custom widgets for everything.
Lynn, you're right, and it's a limitation at this point, but we are planning to remove it in the future. Thank you for the feedback!
We've noticed that "Next Month" appears above "Next Week" in a table view, which is out of order. What controls this?
Hey kittymomma, are you using Firefox browser?