Leveraging dates in reports

There are many dates in Wrike—project start dates, target completion dates, task dates, etc. and it would be ideal if these could roll up by month for reports. I would love to be able to see how many projects are expected to start by month or end by month, etc. There is no way to do this unless we add a custom field for month and have all users manually update the custom field. Since the dates are already in the system, it would be way more efficient and accurate if the roll up was done automatically. Thank you for considering!
Hi thank you, I am aware of this but it does not help because that is only showing me one month. I would like to see all data over many months but have it roll up by month.
I'm not sure how this doesn't have more votes. There's got to be another suggestion with more votes. Grouping by date in reports, or rolling up the date in reports, whatever we should call it, is a definite must-have. I'd like to create charts to show the progress over time, which can be done using custom fields. Here I'm requiring the user to input the month and year on a request form so I can build a submitted-tasks-by-month chart.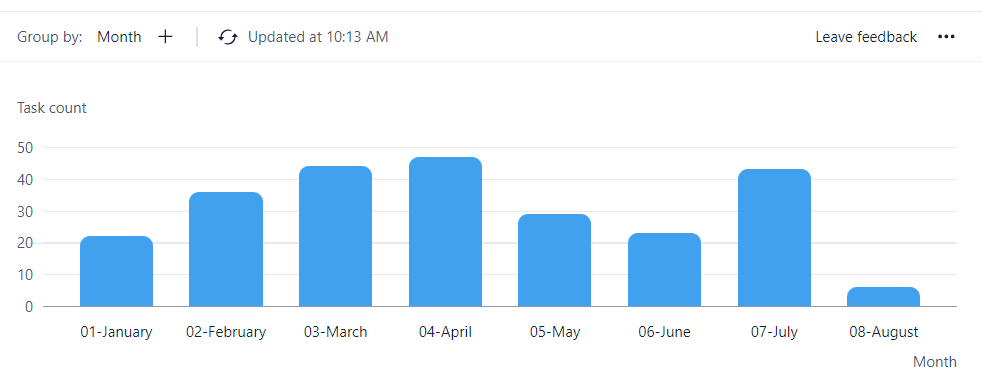
I'd like to do the same when closing the task, but since closing is just checking the box to make it completed, I cannot force the user to input a closed date. (I can only ask nicely). I'm stuck trying to use the custom reports, which can only show 1 month at a time. Below is my report for closed last month (which uses the completed date filter, below). I also think this feature exists in Wrike Analyze.
Filter:
Hi Mike Fank! When you use the "Completed date" filter, you can also chose the "Custom time frame" option:
Could that be helpful?
Lisa Community Team at Wrike Wrike Product Manager Become a Wrike expert with Wrike Discover
Lisa Wrike Team member Become a Wrike expert with Wrike Discover
Lisa - Yes, but that's what I've done, but it doesn't show any trends. If I filter for all completed with a date for the first 1/2 of the year:
Then the charge choices are either all in 1 bar:
Or I group by completed date, but Wrike doesn't have an option to group by month.
I'd like to have a nice monthly chart like in my first post.
Got it Mike Fank, thanks a lot for clarifying and providing a detailed use case!
Lisa Community Team at Wrike Wrike Product Manager Become a Wrike expert with Wrike Discover
Lisa Wrike Team member Become a Wrike expert with Wrike Discover
@... or Lisa - With the new dashboards we can do exactly this!
Mark this one complete!
Thank you Mike Fank!