Historical data analysis and trends

I would love to be able to analyze historical change data.
For example, I would like to see how often tasks missed their deadlines over the last year. Or the average number of days tasks were overdue. Or which user was rescheduling tasks the most in the last quarter. etc. etc.
A fantastic short term solution to this would be to make the Stream data exportable as csv/excel. With an option to choose date parameters, given the size of the Stream over time.This would allow powerful analysis in Excel without huge front-end development from Wrike.
A medium/long-term solution would be to have either a Stream report builder in the reports section, or a Stream analysis section in the Analytics.
Wrike is fantastic at the current status, but I've found it would be just as useful to track trends.
I hope you'll consider this, even if just the Stream export for advanced users.
Hi Oliver, thanks for sharing this feedback after suggesting this idea to our Support Team. Now other members can vote and discuss the idea!
I love this.
Would also like to see who changed tasks and when. Dates changed, etc, by whom, and when.
Thanks,
Andy
Also the approvals duration time would be grat to know. Thanks
Hey Stefano Coccato! 🙋🏻♀️ I believe this is possible using Dashboards, as they can be used to track a variety of metrics—including approvals and approval duration. 👇🏼
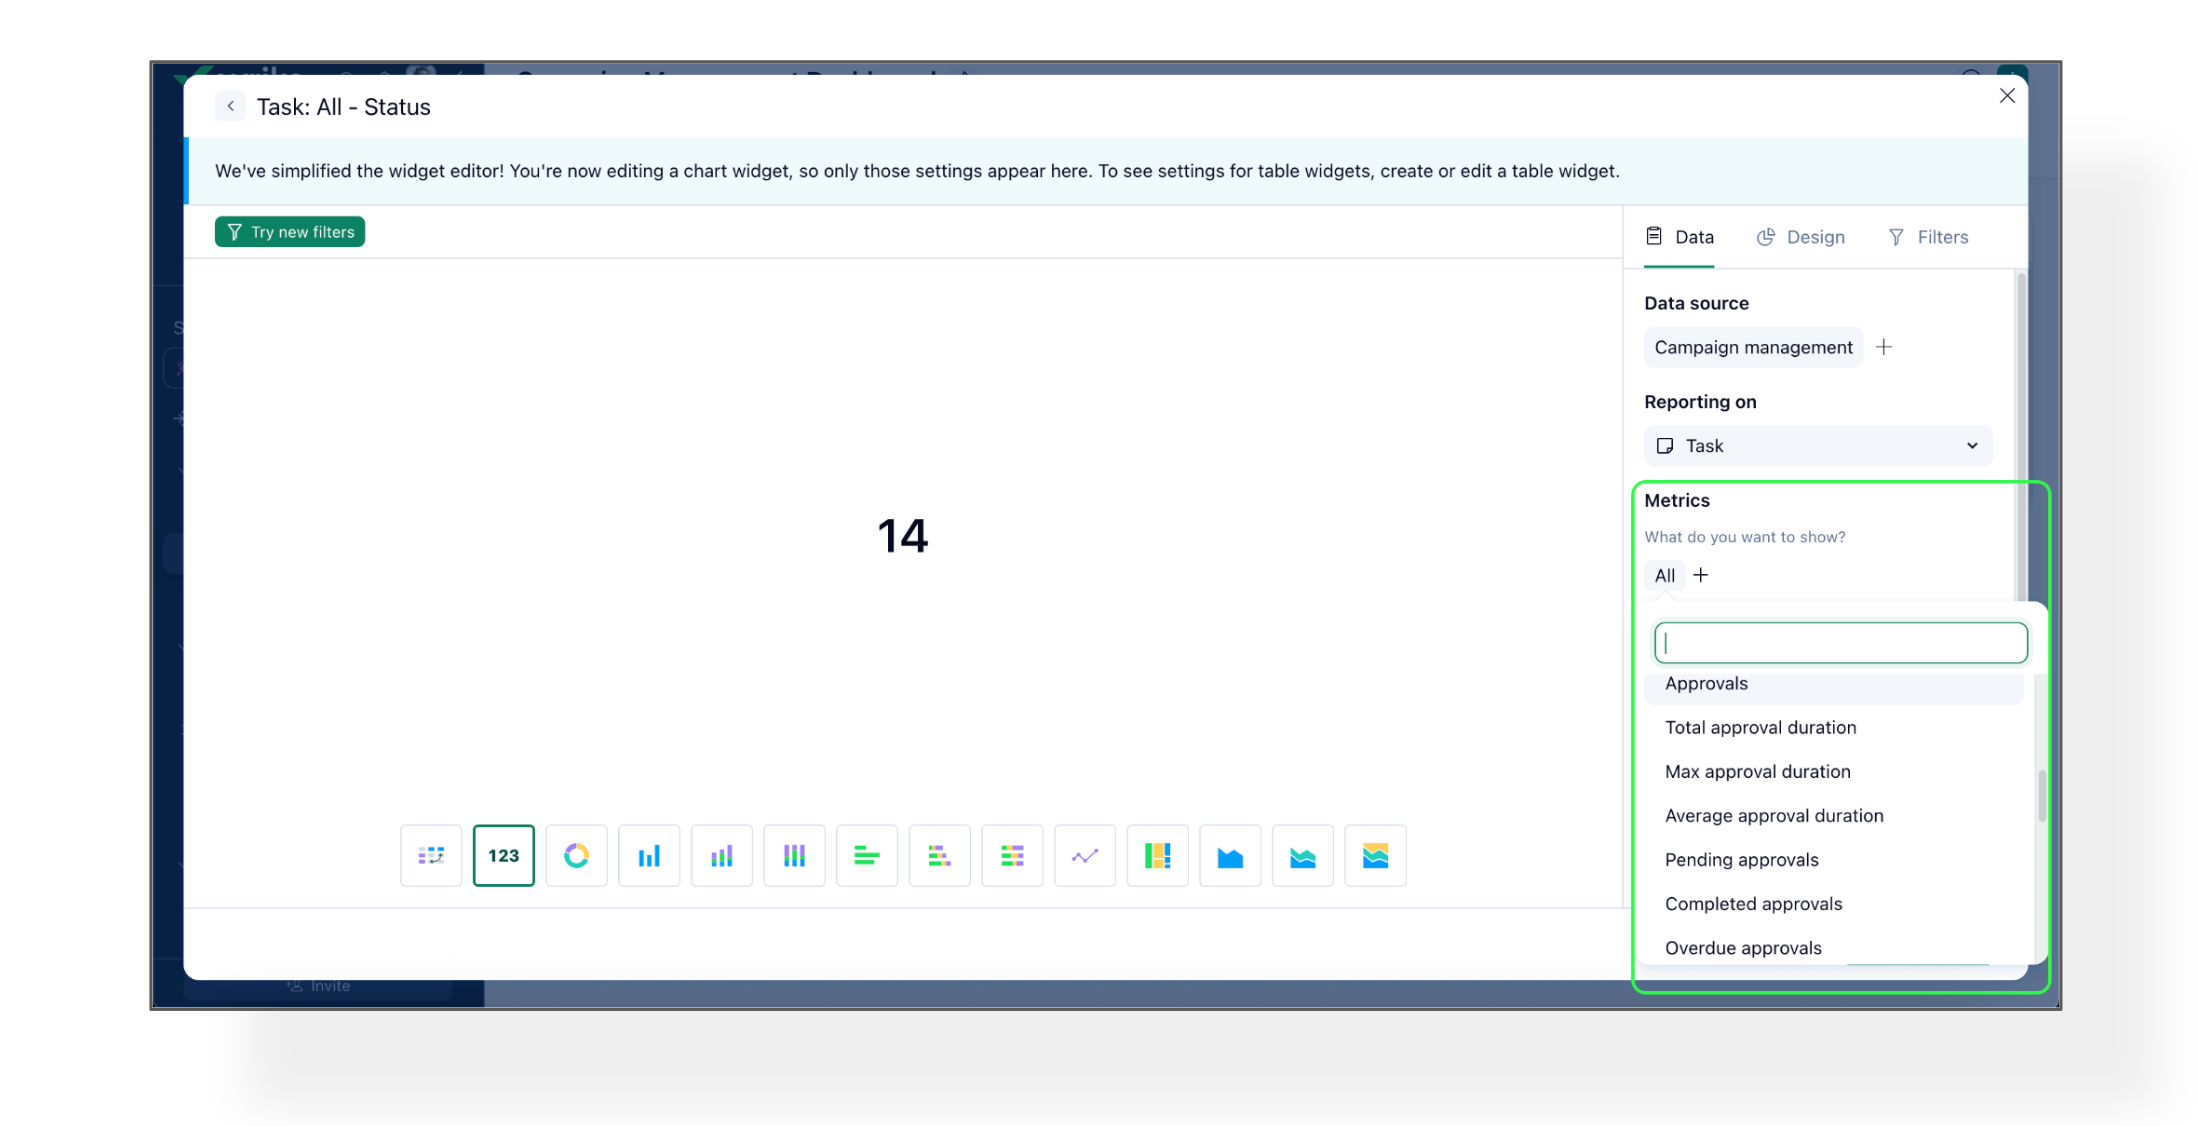
You can read more about metrics in this Help Center article. Thank you! 😊
Basudha Sakshyarika Community Team at Wrike Wrike Product Manager Become a Wrike expert with Wrike Discover
Basudha Sakshyarika Wrike Team member Become a Wrike expert with Wrike Discover