Analytics, Capacity Planning and Actual Effort

In Analytics there are two reports 1) Utilization and performance, 2) Capacity Planning.
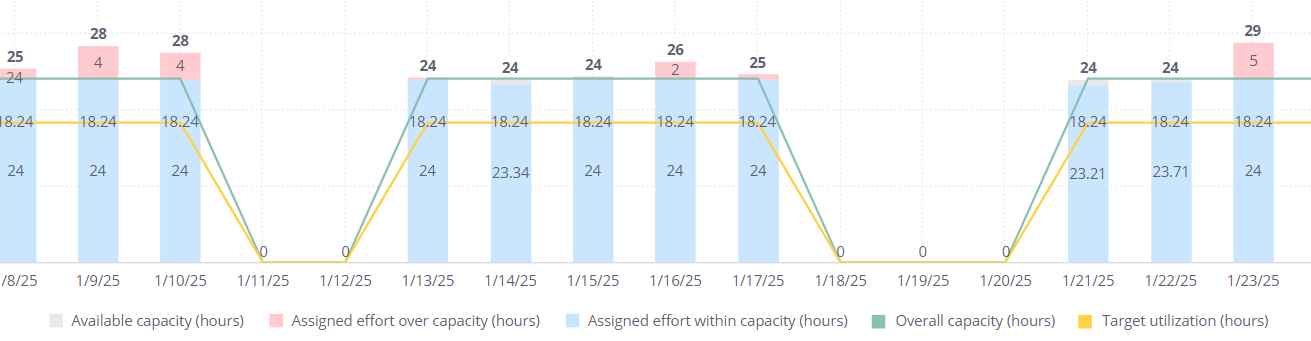
Capacity planning has some robust graphics that we are leveraging by using adding a field called "Effort" to all our project plans which ties to a task and a resource.
If we coupled an "Actual Time" field with this graphic, it would be an amazing tool that would be a one stop shop to look at resources.
One additional gap I haven't been able to get across the line is every vertical in our IT has different available time to work on projects as they are also ticket driven for keeping the lights on tasks...which makes it challenging in having a single chart where you could select different resource groups.
Of course we could spin up one chart per vertical but that doesn't roll up to a holistic view.
Has anyone been successful with this? If so, please elaborate.
Respectfully, Jeff
Hi Jeffrey Bond, thanks for posting your feedback, it has been passed along to the relevant team to look into 👍
Rohan V Community Team at Wrike Wrike Product Manager Werden Sie ein Wrike-Experte mit Wrike Discover
Rohan V Wrike Team member Werden Sie ein Wrike-Experte mit Wrike Discover