How to Use Wrike's Gantt Charts
A Gantt chart is an advanced way to track the timeline of your project. You should be using it to get a high-level view of projects that are in progress and how these are impacted by the other projects coming up or running concurrently. The biggest benefit of a Gantt chart is to help you plan around big milestones and visualize the scope of your projects.
Before You Start, You Should Know:
1. Tasks will only show up on the Timeline if they have a date attached to them, by nature of their calendar-like functionality. This means your "backlogged" tasks will not appear until you give them with due dates.
2. Make sure you always give clear names to your tasks (and folders too). You should be able to grasp most details from the task name. "Send to customer" is not clear. Send what to customer? "Send standard contract to customer" is much clearer when viewing a Gantt chart.
Putting Your Tasks into Wrike
When you're ready to start putting your work into a Gantt chart, you will be in one of two situations:
- You already have your schedule laid out, or
- You still need to create the schedule for your tasks.
In both situations, we first need to make sure all your tasks are in Wrike.
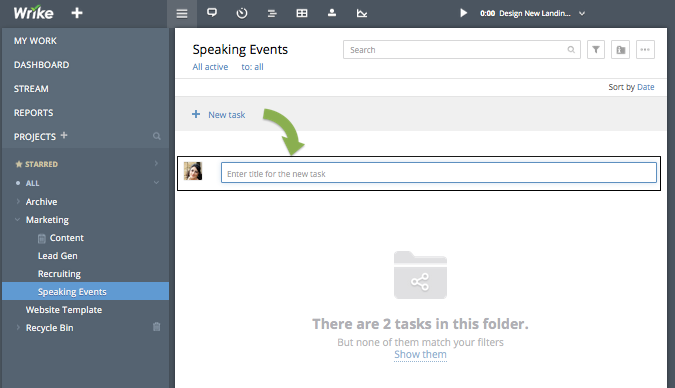
The best place to do this is in the Task List view. In this view, you can use the Quick Add feature to get all your tasks into your workspace with minimal effort and in one fell swoop:
- Choose the correct Project/Folder where you want to enter your tasks.
- Click "+ New Task" at the top of your Task List view.
- Type your task name and hit Enter.
- Repeat until all tasks are in your workspace.

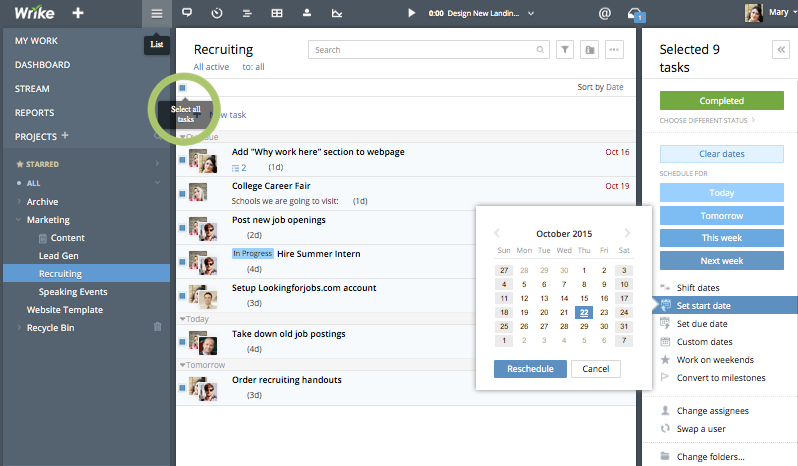
Now, in order to get these tasks to show up on your Gantt chart, they must have due dates. You can also assign dates quickly using our shortcuts in the Task List view:
- Hover over the right side of a task in the list; a small calendar icon will appear.
- Click this icon and choose the correct due date for each task.
- If you already know the duration of the task (how long it will take to complete the task), you can also set that now.

Do not set tasks as milestones unless it is the end of a project (e.g. your big launch date, an event date, or a final deadline). For most projects, you should only have one task that is a milestone event. If you're unsure right now, you can still set tasks as milestones later on.
If you are in situation 2 from above (no schedule yet), add the same date to all of your tasks — a date close to your potential start date. This will make the tasks show up on your Gantt chart, and then you can easily reschedule them from there using drag-and-drop.

Adjusting Your Schedule on the Gantt Chart
Now that all your tasks and dates are entered into Wrike, it's time to look at your Gantt chart.
Setting Task Start and End Dates
Now that you see the visual representation of your schedule, double-check your schedule to see if it still makes sense and adjust as you see necessary.
If you haven't set your schedule yet, now is the time to drag and drop your tasks into place on the timeline to assign their start and end dates. Keep in mind what order tasks need to be completed in as you create your schedule.
Now that your schedule is finalized, you should set your final due date as a milestone if you haven't already; it will show up as a small flag on the Timeline. This is helpful because if you shift the schedule for project tasks forward or backward, the milestone will not move with them. Milestones are designed for projects with a fixed due date and no room for change. (E.g. You've already publicly announced your launch date, or a customer gave you an absolute deadline.) Click the task that should be the milestone, choose "Convert to milestone", and double-check your date for accuracy.
Setting Task Dependencies
One of the main purposes of using a Gantt chart is to set up your work dependencies. Which tasks depend on other tasks to start or finish? You can connect tasks in one of four ways:
- Task A can't start until Task B has been completed.
- Task A can't start until Task B has started.
- Task A can't be completed until Task B has been completed.
- Task A can't be completed until Task B has been started.
If the only dependency in your schedule is related to your milestone event (e.g. you cannot complete your milestone event until all the tasks have been completed), then attach all your tasks to your milestone. On our Gantt charts, you can set task dependencies using drag-and-drop. Drag the line from the beginning or end of Task A to the beginning or end of Task B to set up your relationship.
After you set up proper task dependencies, your Gantt chart will automatically reschedule all connected tasks if the start or due date for one task changes.
Checking in on Work Progress
Once your Gantt chart is fully set up, tasks are assigned, and work is underway, you can now refer to your Gantt chart to check on progress.
Gantt Chart Color-Coding for Quick Glances
When you open your Gantt chart, today's date is denoted by a red vertical line. As work progresses, you will see three possible colors for the tasks on your Gantt chart:
- Green: These tasks have been completed already. Note that this does not necessarily mean they were completed on time, but they are complete as of this moment.
- Red: These tasks are still in progress, and overdue. As a manager or colleague, you can click to open the task and ask the task owners what is delaying completion.
- Blue: These tasks are still in progress, and not overdue. If you're concerned about progress, click to open the task and see how work is coming along.
If you are an Enterprise user, the Blue/Red/Green color-coding may be overridden if you have customized your workflow by creating Custom Statuses. Instead, your tasks will show up in the color preset for its current custom status.

When you're checking in on progress, remember to take a look at the dependency lines. If Task C is dependent on the completion of Task B, and Task B is dependent upon the completion of Task A, any delay can bottleneck your entire project. If you see that a deadline is coming up for a depended-upon task, check in to make sure work will be completed on time, so that it doesn't break the flow of the project and endanger other tasks — or even worse, your milestone.
Using Filters to Find What Matters
If you only want to see the Gantt chart for certain work statuses, specific task owners, dates, or other criteria, you can filter your view of the Gantt chart.


Can you help? Answer the question and work your way towards becoming a Wrike Ninja 🥋 Sign in and answer.
Войдите в службу, чтобы оставить комментарий.